Alexander Jahrer
AI Development
Wenn du blind bist kannst du net schaun!
~Stefan Jöbstl
English
The Stadtwerke Klagenfurt currently
only have static tariffs. There is data from around 320 smart meters
(which transmit quarter-hour values) and from two energy markets, but
this data is not yet used to create dynamic tariffs. The two energy markets
are the futures market and the spot market, which determine the electricity
price.
The quarter-hourly values from smart meters in Klagenfurt and energy
market prices are analyzed using algorithms and artificial intelligence.
This creates an improved tariff for the end user and the Stadtwerke Klagenfurt
benefit from improved electricity purchases. The result is then saved in a database
and is available as a file.
German
Die Stadtwerke Klagenfurt haben momentan
nur statische Tarife. Es gibt Daten von ca. 320 Smart Meter
(die alle Viertelstunden-Werte übermitteln) und von zwei Energiemärkten,
jedoch werden diese Daten noch nicht zum Erstellen von dynamischen Tarifen
verwendet. Bei den zwei Energiemärkten handelt es sich um einen
Termin- und Spotmarkt, welche den Strompreis bestimmen.
Es werden die Viertelstunden-Werte von Smartmetern in Klagenfurt und
Energiemarktpreise durch Algorithmen und Künstliche Intelligenz analysiert.
Dadurch wird ein verbesserter Tarif für den Endnutzer erstellt und die Stadtwerke
profitieren von einem verbesserten Stromeinkauf. Das Ergebnis ist dann in
einer Datenbank gespeichert und ist als Datei verfügbar.
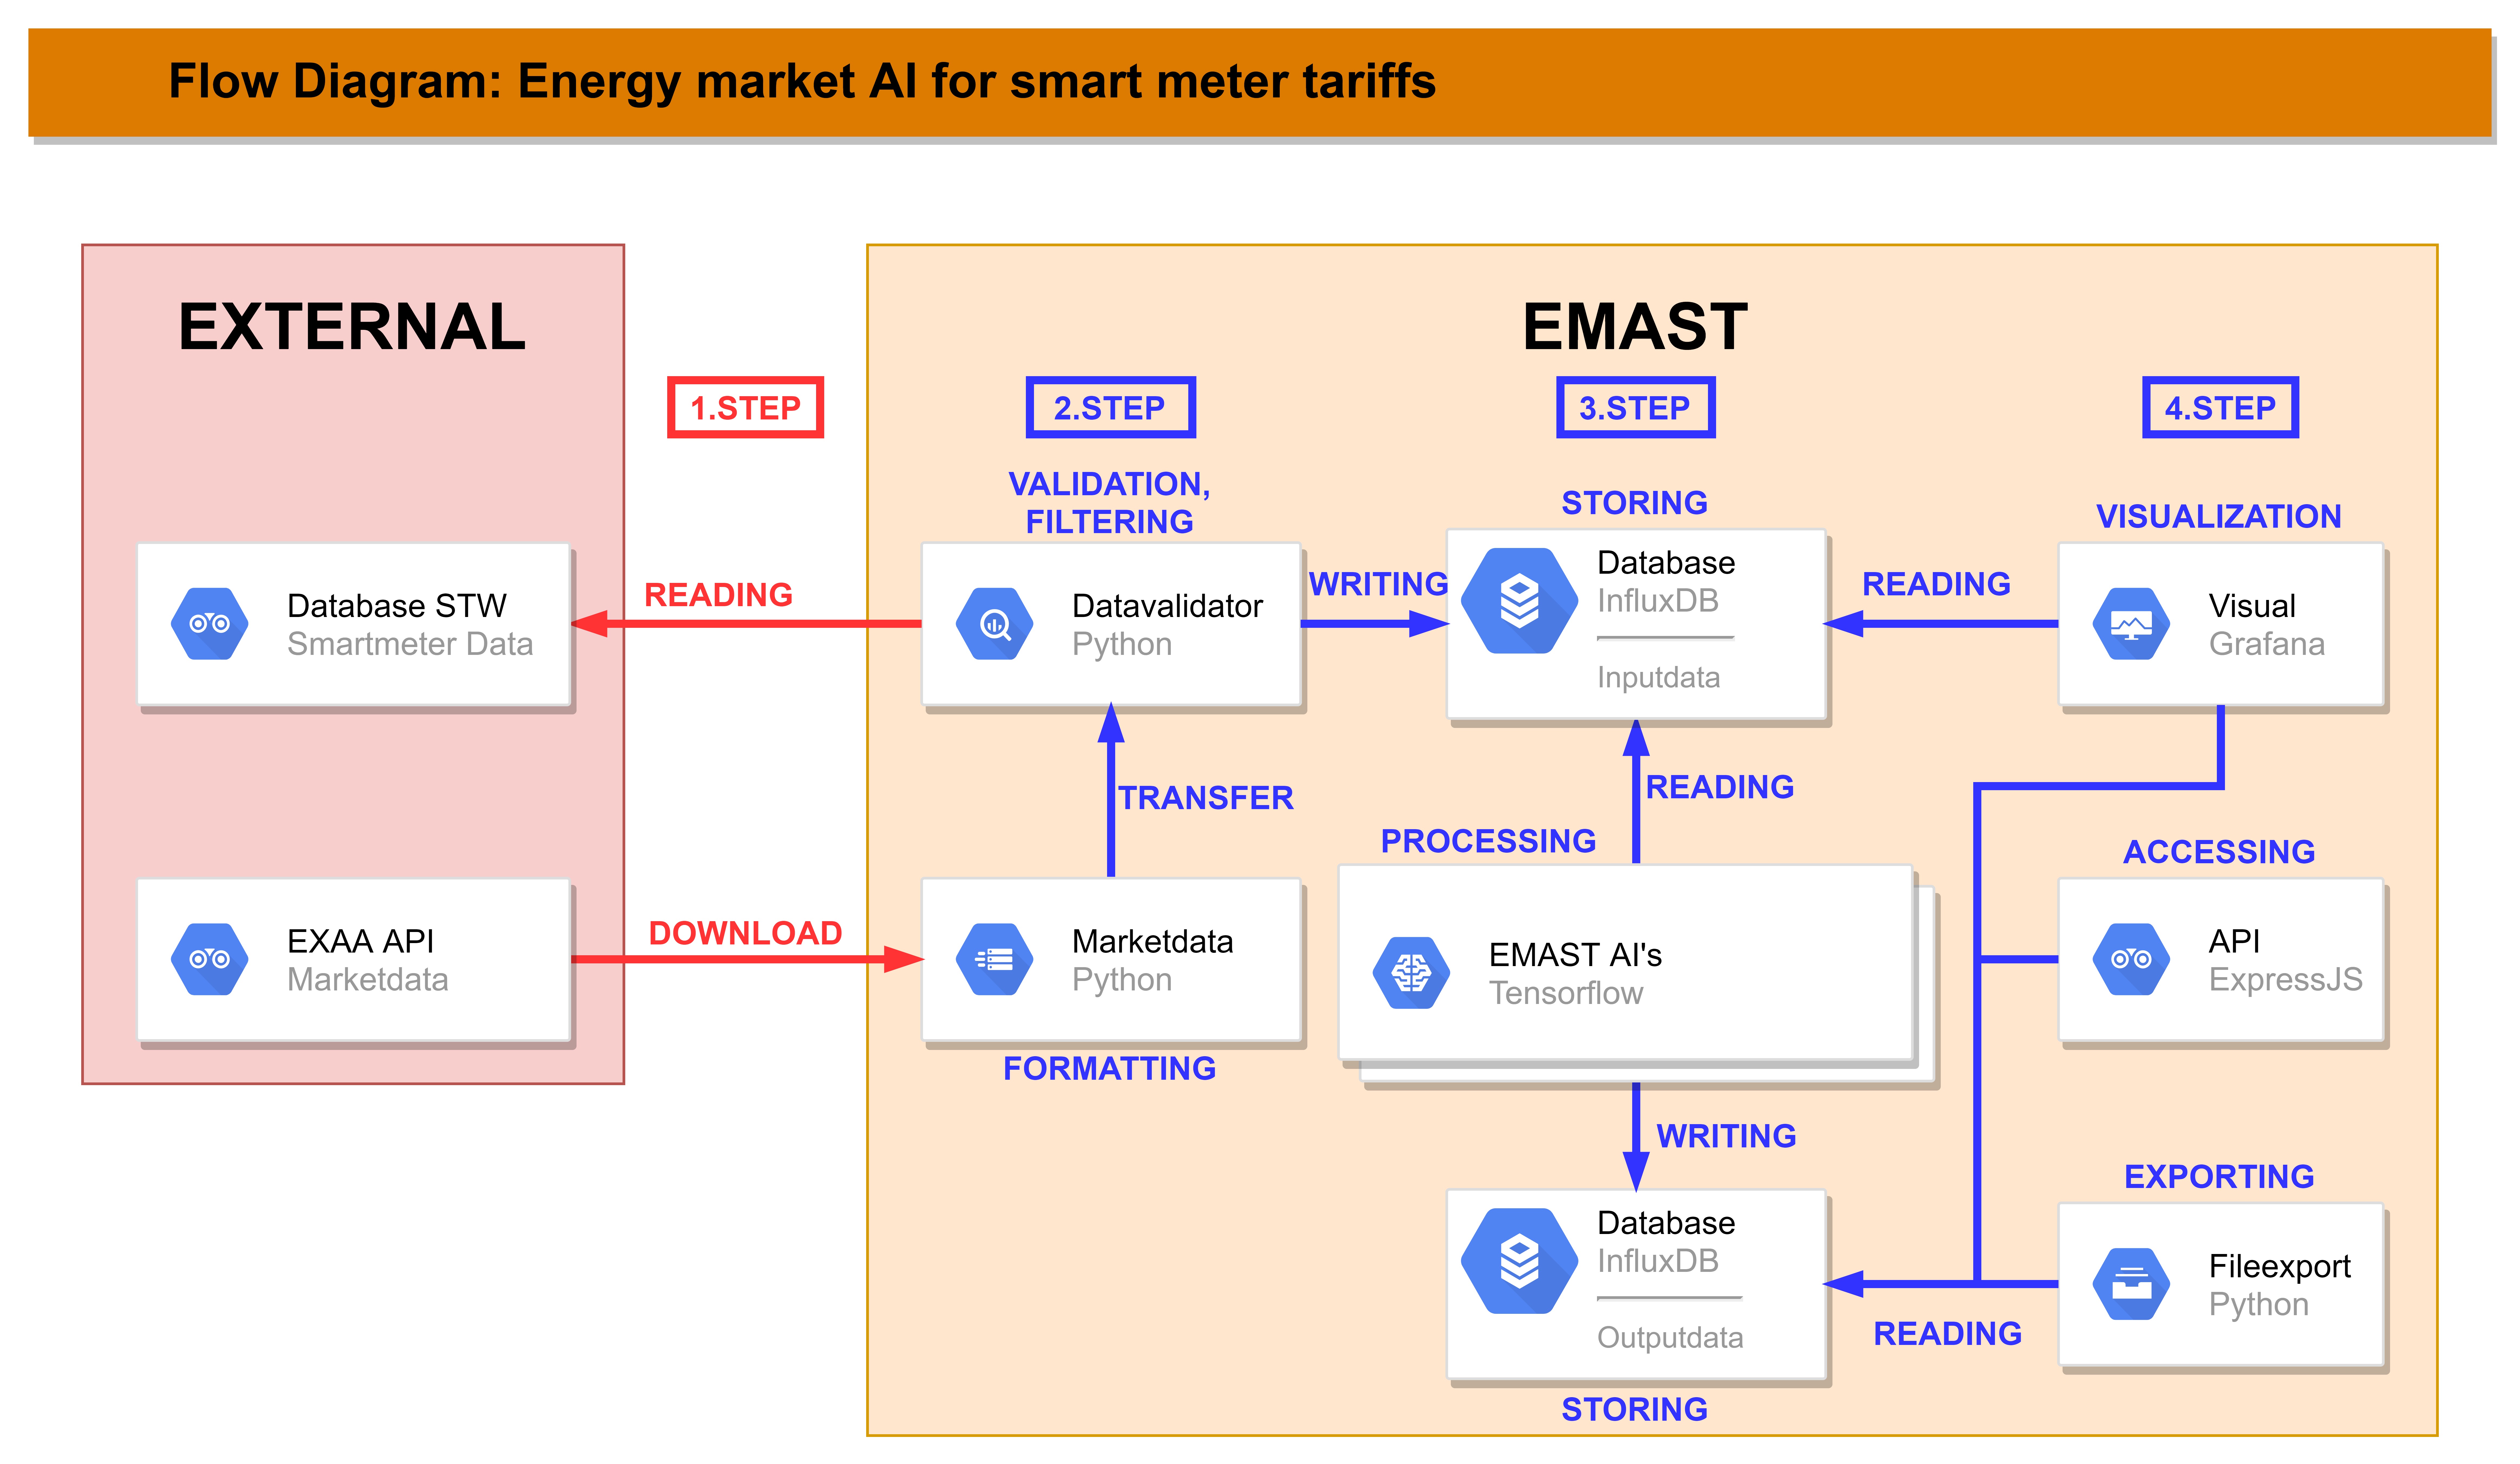
Here is a short overview of how our projekt works and what components we use.

The flow of EMAST can be broken down in 4 steps: - Step 1: Downloading information from APIs and reading data from the STW database - Step 2: Formatting the data from web and validate all data. - Step 3: Store the input data, process it through the AI and store the output. - Step 4: Visualize the output and input, make it accessible through an API and export it as a file.
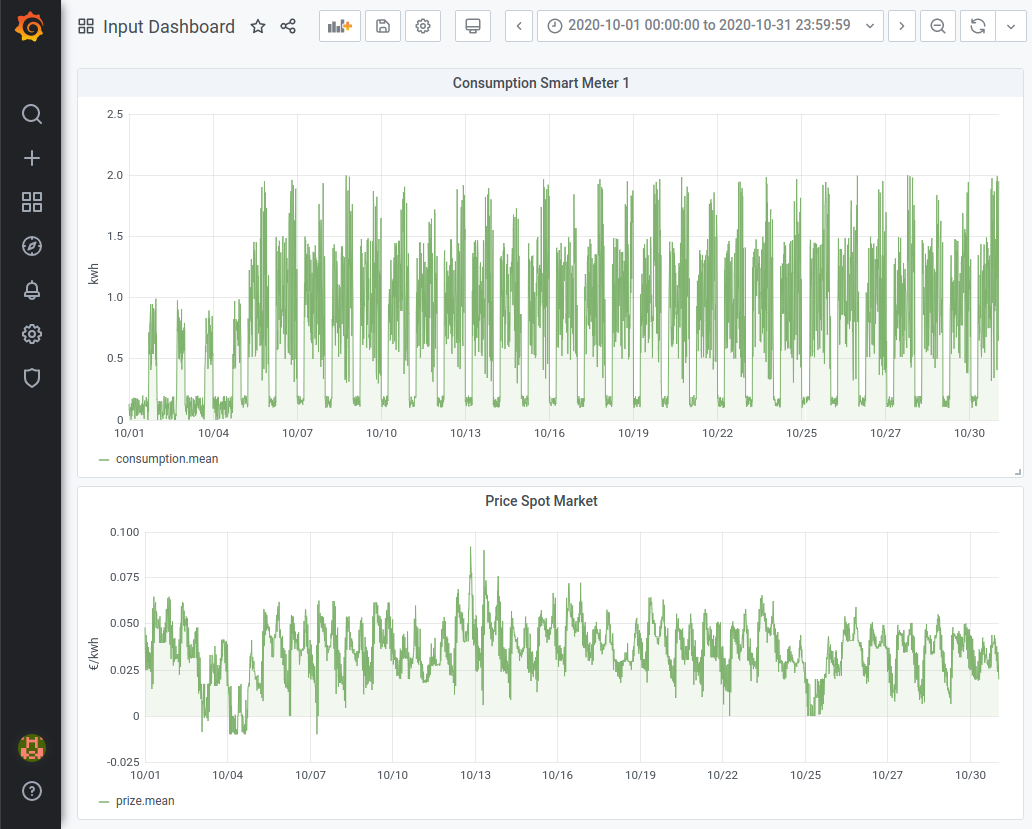
Grafana is tool that is used to analyze and visualize data from a database. EMAST is using it to visualize the input data and also the output data. You can test the visualization by clicking at the Grafana logo down below.


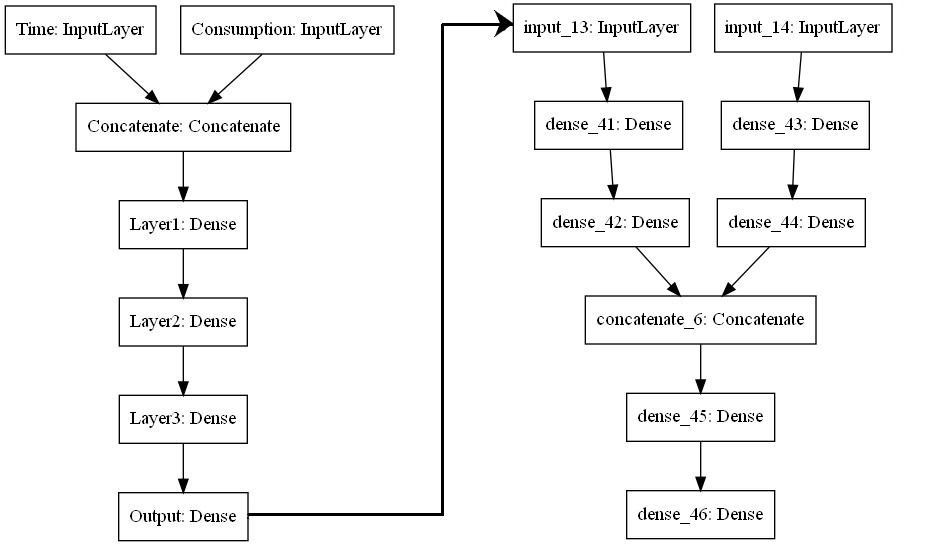
We need two AIs to accomplish our goal, because there are two energy markets the Stadtwerke Klagenfurt get energy from. Each AI predicts the amount of energy for one of those Markets. With the consumption and user data from the past few years as input data the AI has a good foundation, but to train an AI it needs to be given output data. In this case that would be how much futures and spot energy should be bought. This output data must be calculated by hand or with an algorithm.
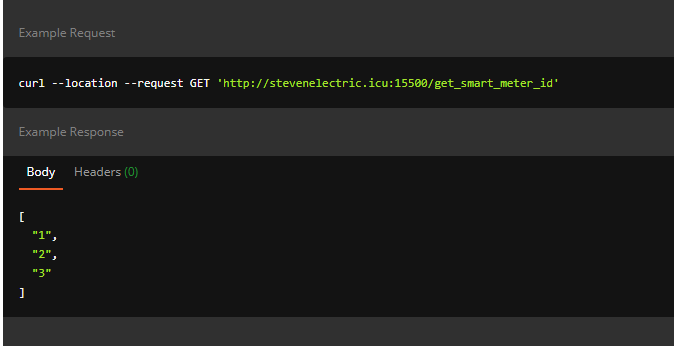
The export of the data is done through two different interfaces. There is a CSV file for importing data into the STW database that is updated every day. In addition, a Rest API interface is available where data can be retrieved through simple GET requests. The Documentation of the Rest API can be reached by clicking at the Postman logo.
