Jana Nina Friedrich
Management, Analyzer & Visualsation
Hello there.
English
The project S.E.A.L. originated in a cooperation between the school HTL
Mössingerstraße and the company Bitmovin. The project analyzes encoding log files
from Bitmovins production system, extracts performance related metrics, stores the data and
presents the filtered information in an easily comprehensible way. In addition, the development
team is notified via the communication tool Slack in the event of an error in the log
files.
German
Das Projekt S.E.A.L. entstand in einer Kooperation zwischen der Schule HTL
Mössingerstraße und der Firma Bitmovin. Das Projekt analysiert die
Encoding-Logfiles aus dem Bitmovins-Produktionssystem, extrahiert leistungsbezogene Metriken,
speichert diese Daten und präsentiert die gefilterten Informationen auf leicht verständliche
Weise. Zusätzlich wird das Entwicklungsteam bei einem Fehler in den Logfiles über das
Kommunikationstool Slack benachrichtigt.
At the beginning, we should repeat that our project is being processed and created at HTL Mössingerstraße in a cooperation with the business partner Bitmovin.
Next, we are giving you a brief overview of S.E.A.L.
So the first question you are going to ask is: Why does Bitmovin need such a system?
There are actually many reasons. Right now, you have to look at every log file individually and each log consists of many text lines. The problem is that everyday over thousands of log files are produced and you easily lose your overview. The task to find the information you are looking for is very time consuming and quite hard. As an addition the seekers have to know the logs or they are never going to find anything.
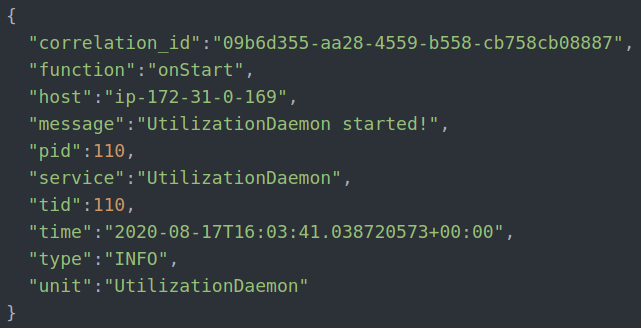
On the left side you can see the structure of one log line. The used format is similar to JSON. This example is already prettified, normally this text would stand in one line.
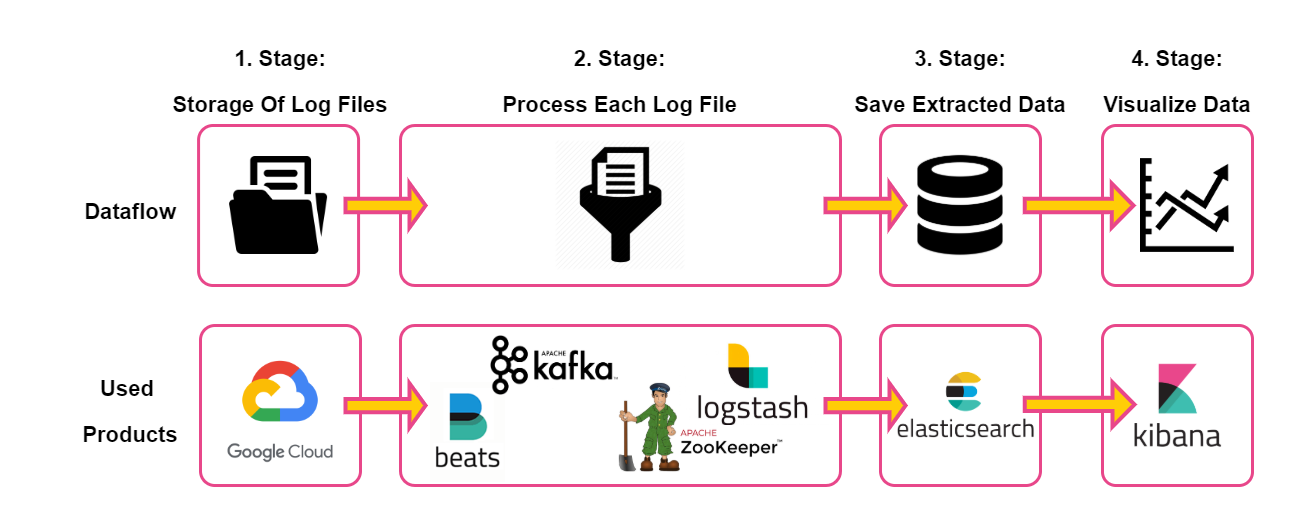
To understand S.E.A.L. you have to understand the data flow. On the
right side you can find an illustration which shows a simplifed data flow where
S.E.A.L. has been broken down in four stages:
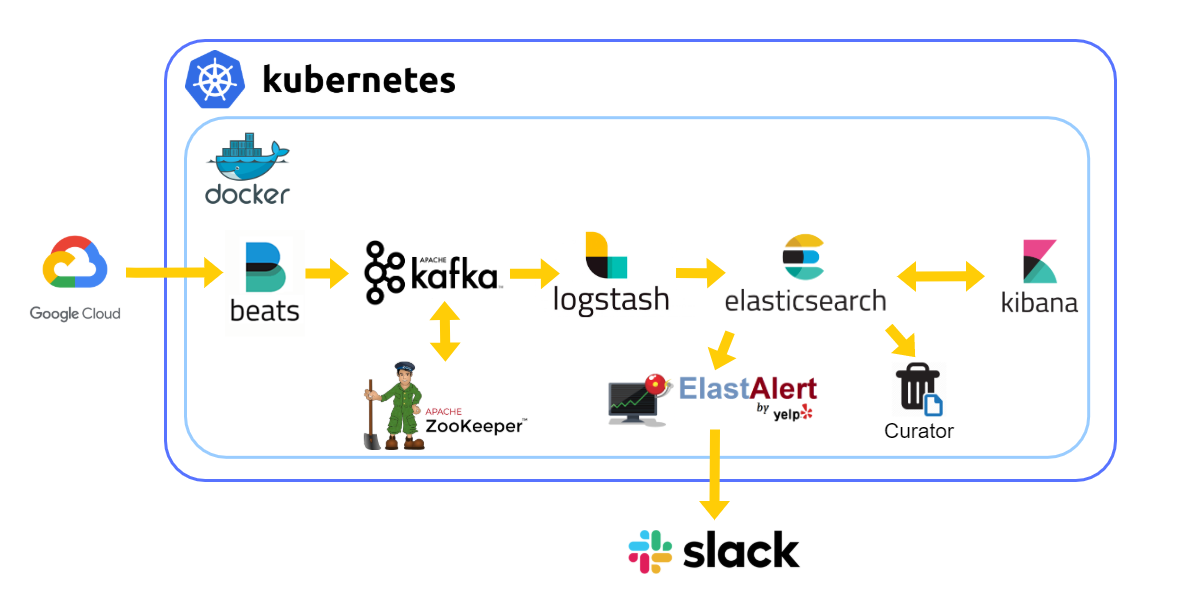
The seconde picture illustrates the detailed project desgin:
For each encoding job a log file is generated and automatically uploaded to
a
Google Cloud Storage
bucket.
The GCSBeat collects the log files and passes them via Kafka
to
Logstash, where
Logstash extracts the relevant information and stores it into
Elasticsearch.
Kibana has access to the stored data and visualizes it.
The final system is running in the Kubernetes-Cluster of
Bitmovin so that every Bitmover can access it.
Every service is running in one Docker Container. Because the stored
data is useless after half a year and to save space in Elasticsearch the extracted
data gets deleted through the service Curator.
The saved data gets monitored by the service ElastAlert. If an alert
is triggered, ElastAlert writes a message into a Slack Channel. Slack
is the primary communication tool of the company.
The video below shows the possible functions of how to use Kibana. The
description of the video can be found here:
Dashboard page
First, you see is the Dashboard page, on which you can generate
various graphs from the stored data from the Elasticsearch. In this
example video there is a bar chart (left side) and a table (right side) on
the dashboard which both show the values of the metric
"log_mtmuServiceDuration". If you want to find out more from which log lines
the displayed values come from or if you want to do more research in
general, you can go to the Discover page.
S.E.A.L. was submitted to several competitions, including the Jugend Innovativ and innovation@school competitions. We are pleased to announce, that S.E.A.L. is among the 10 best projects of innovation@school in 2020/21.


Hello there.

General Kenobi!

Think different dynamic.

A bit of gin keeps you movin.